SPI – Show PM2.5 Concentration On ILI9341 TFT LCD
If you are not familiar with SPI, please read Introduction to SPI first.
Preparation
AmebaD [AMB21 / AMB22 / AMB23 / BW16] x 1
ILI9341 TFT LCD with SPI interface x 1
Plantower PMS3003 or PMS5003 x 1
Example
This example extends previous PM2.5 example to show the PM2.5 concentration on the LCD.
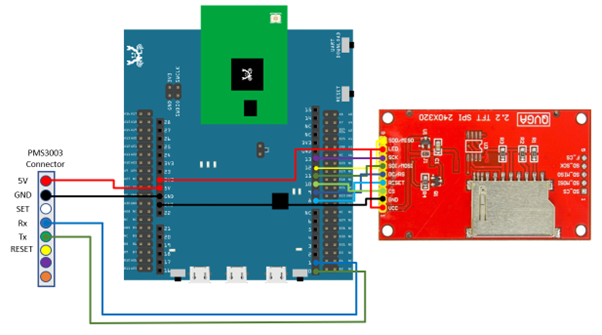
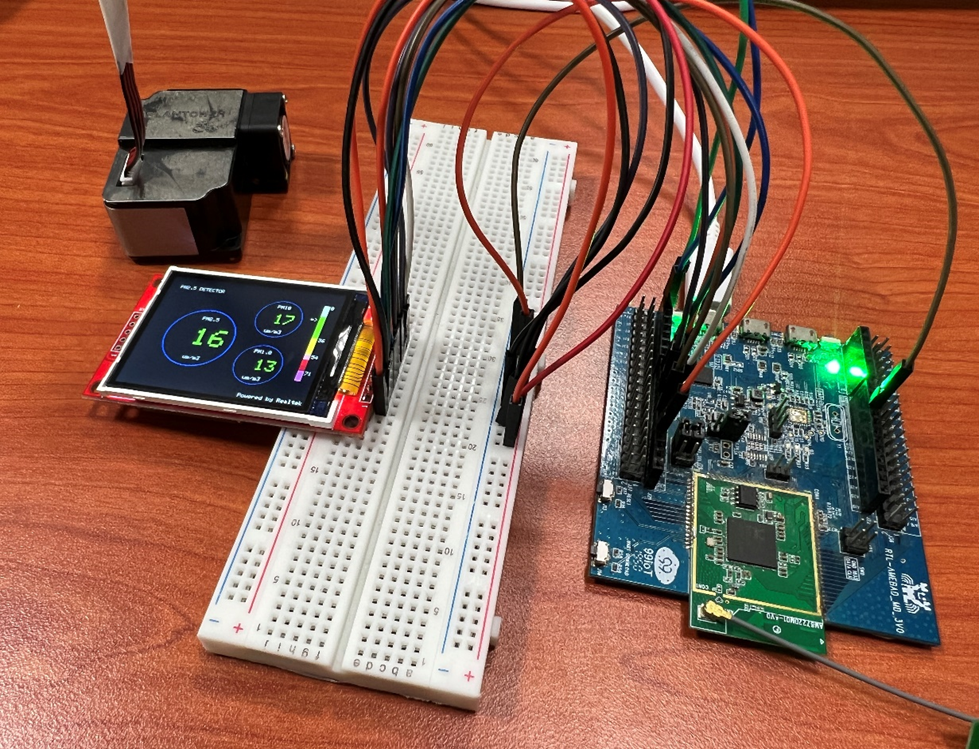
AMB21 / AMB22 and QVGA TFT LCD Wiring Diagram:
Note
PMS3003/PMS5003 sensor requires 5V voltage
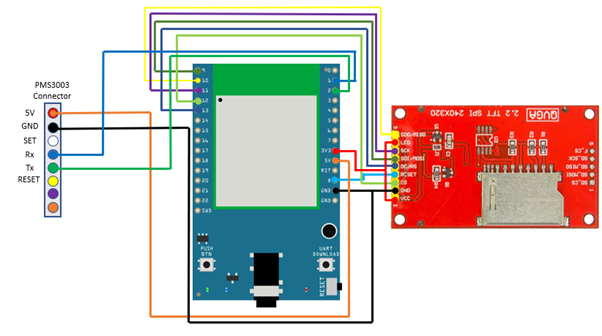
AMB23 and QVGA TFT LCD Wiring Diagram:
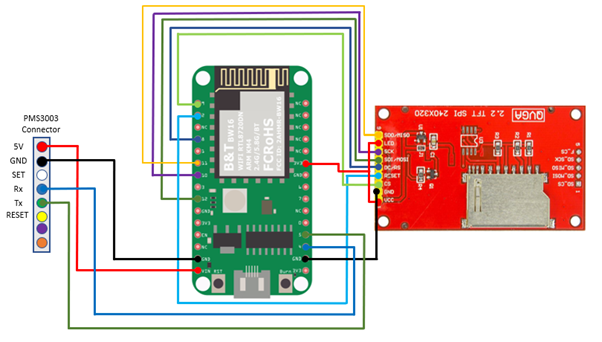
BW16 and QVGA TFT LCD Wiring Diagram:
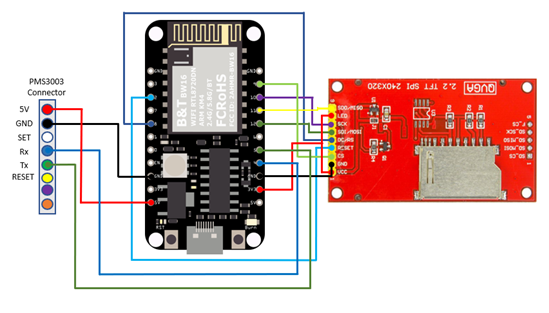
BW16-TypeC and QVGA TFT LCD Wiring Diagram:
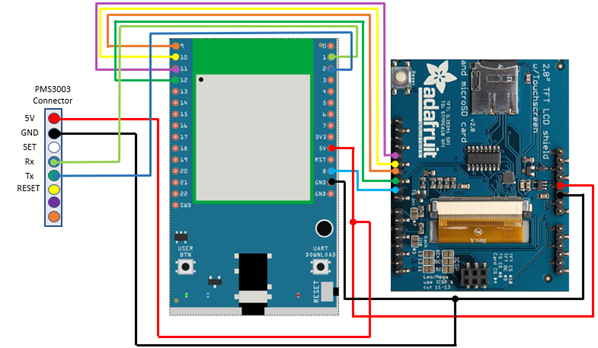
AMB21 / AMB22 and Adafruit 2.8” TFT LCD Wiring Diagram:

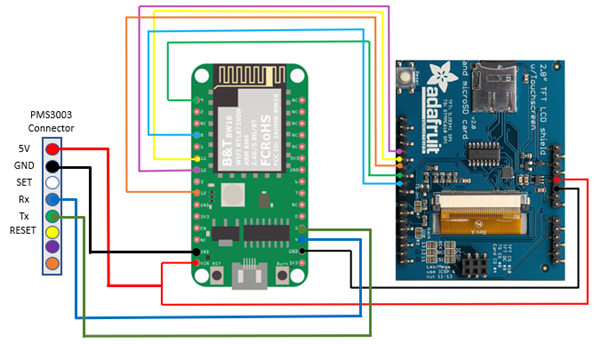
AMB23 and and Adafruit 2.8” TFT LCD Wiring Diagram:
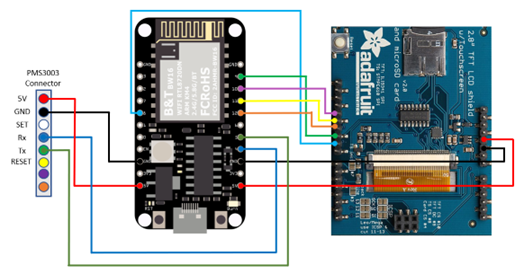
BW16 and and Adafruit 2.8” TFT LCD Wiring Diagram:
BW16-TypeC and and Adafruit 2.8” TFT LCD Wiring Diagram:
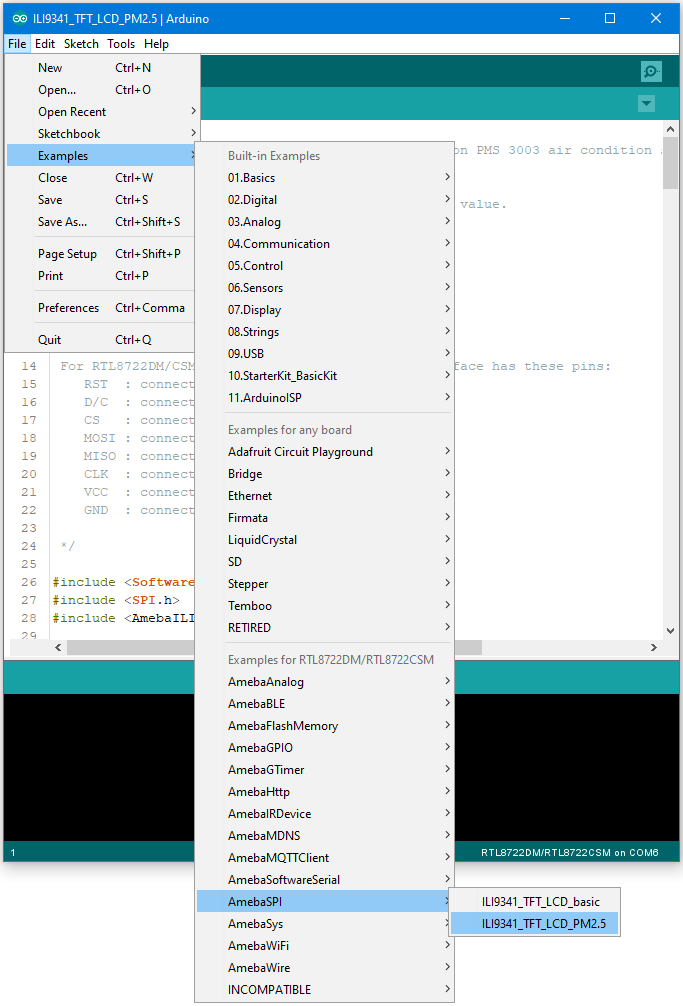
Open the example, “Files” → “Examples” → “AmebaSPI” → “ILI9341_TFT_LCD_PM2.5”
Compile and upload to Ameba, then press the reset button.
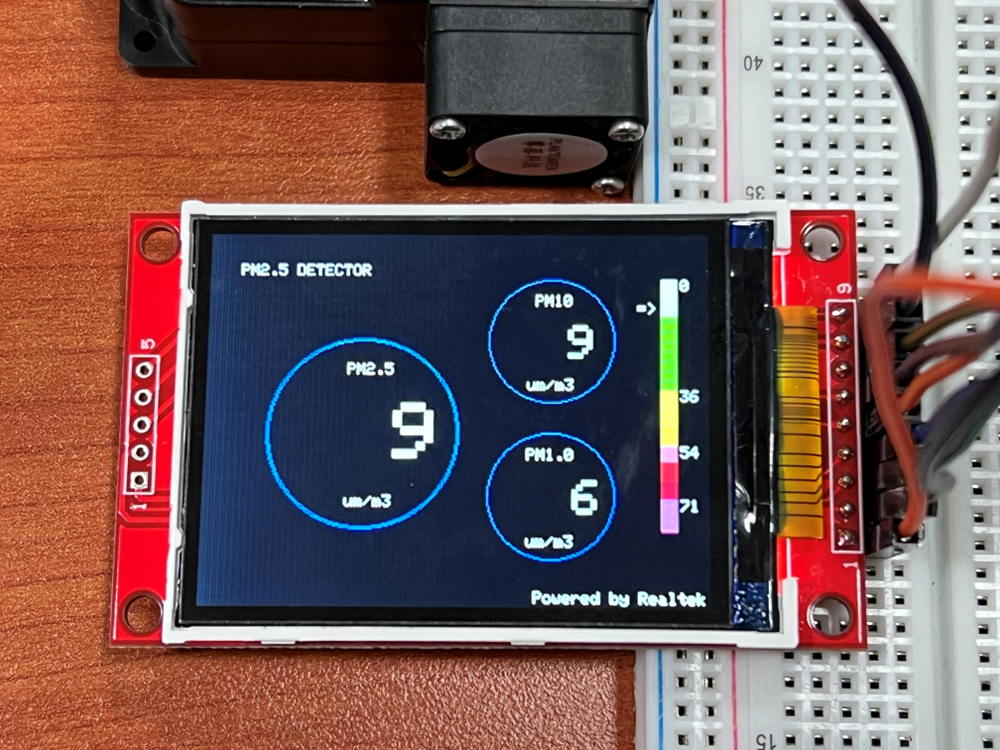
Then you can see the concentration value of PM1.0, PM2.5 and PM10 on the LCD.
Code Reference
In this example, first rotate the screen by 90 degrees, and draw the static components such as the circles, the measuring scale, and the title text. After the concentration value is detected, it is printed inside the circle.